New UI Features and Improvements
The Repfabric Team is happy to announce some changes to our Analytics module:
- New UI Features and Improvements
- New Detail Flat Reports
New UI Features and Improvements
We designed another set of changes to make creating, finding, and configuring Dashboards and Reports easier.
New Detail Flat Reports
We have heard many people want to create Reports that list items, such as Opportunities for manufacturers and customers, without summing any fields—the Detail Flat Reports allows you to do that.
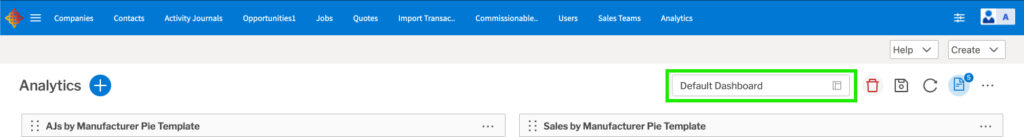
Refresh All Reports on a Dashboard
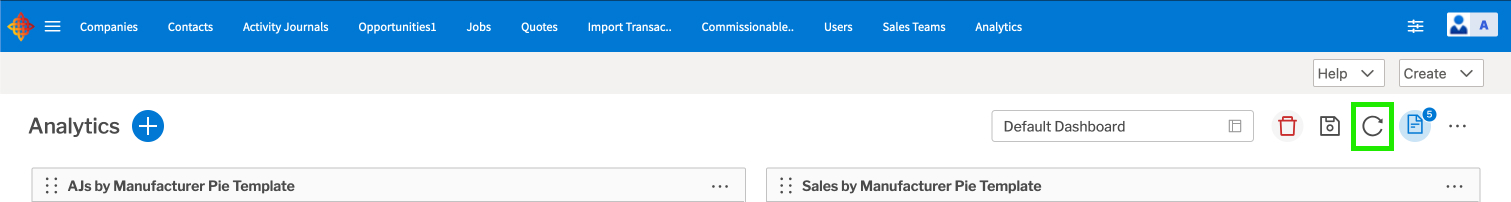
Users will now see a refresh icon between the save and report icons on a Dashboard, which allows them to refresh all the Reports on the active Dashboard simultaneously.

Create New from the Libraries
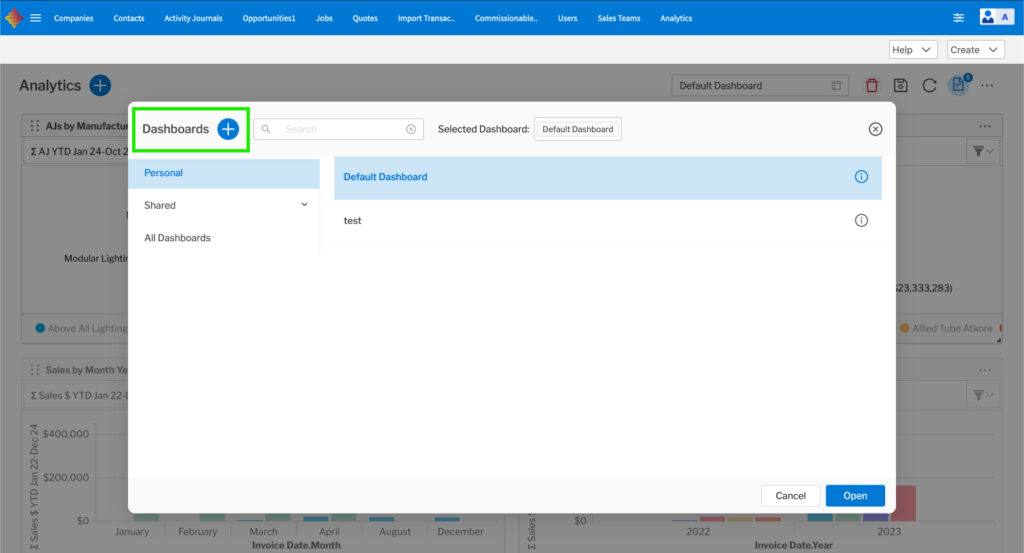
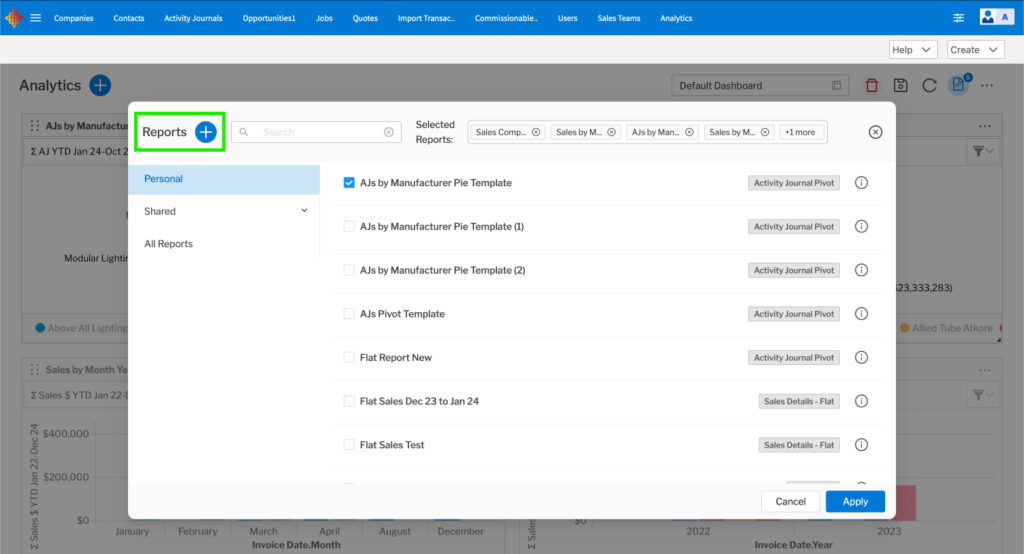
Users can now create a new Dashboard or Report directly from the corresponding library. To do this, click the blue “+” button next to the library title.
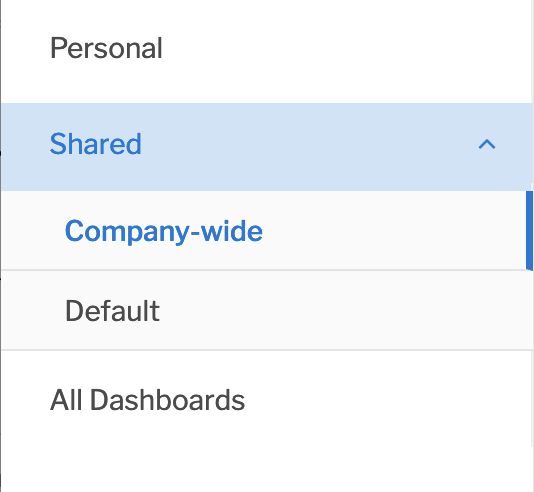
Improved Folder Structure in Library Popups
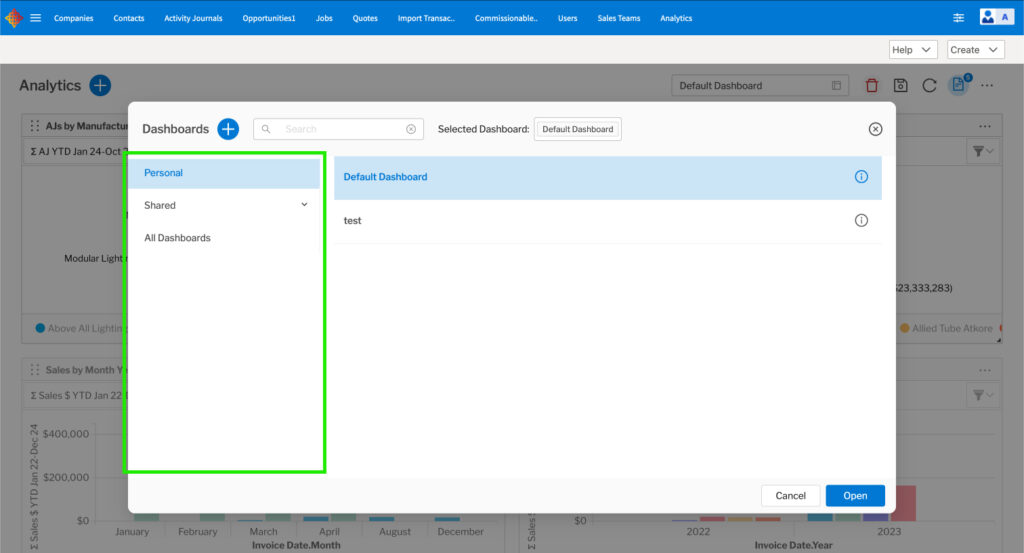
On the left side of the libraries, we moved the “Company-wide” and “Default” folders under a folder titled “Shared,” helping users differentiate between what is personal to them and what is shared.
Configure What Your Default Dashboard Is
Do you want to load a particular Dashboard you have created automatically? Users can now mark a Dashboard they have developed as their Default Dashboard, making it the Dashboard that loads when opening the Analytics module.
To do this, follow these steps in Repfabric:
- Go to the Dashboard library.
- Click the info icon next to the desired Dashboard.
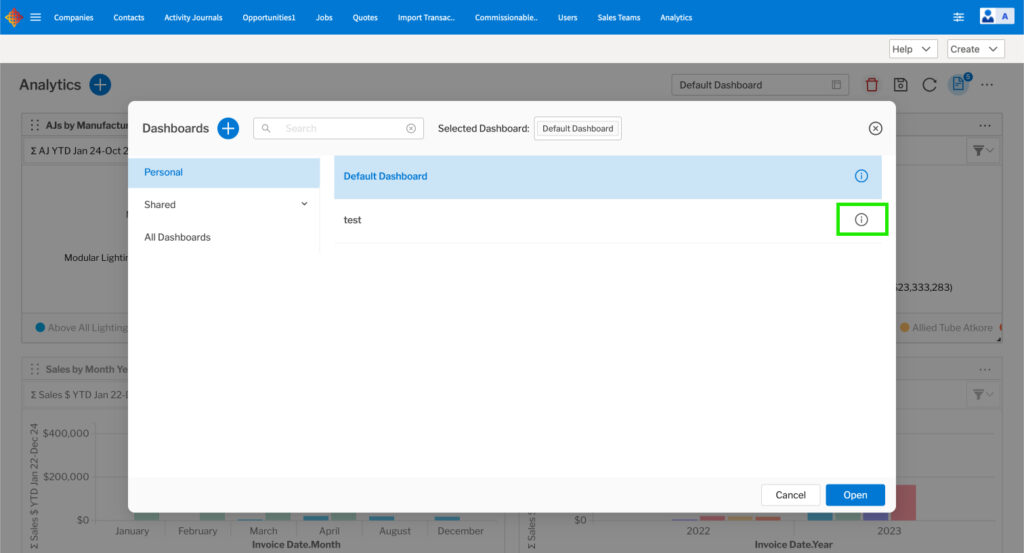
- Click on the checkbox next to “Default Dashboard.”
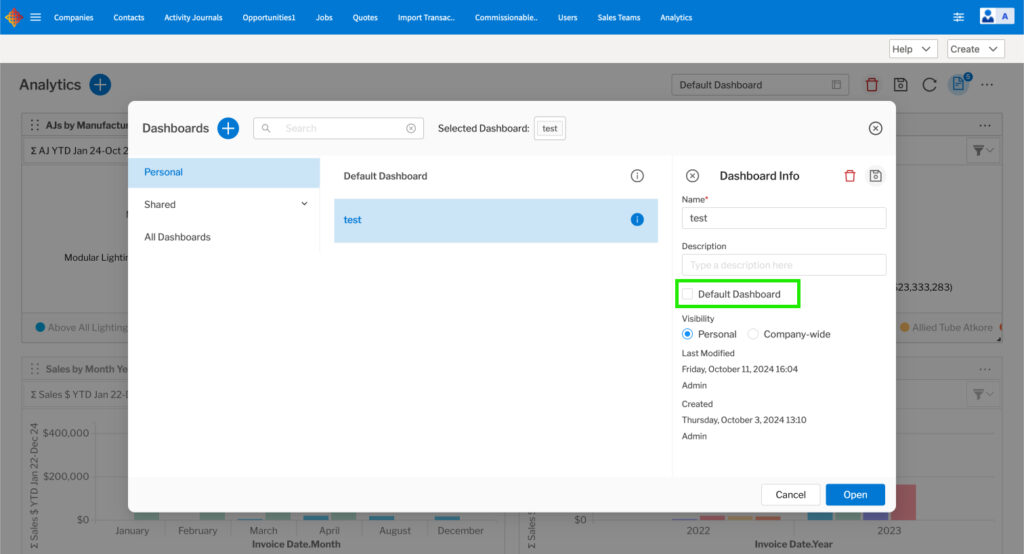
- Then click the save icon.
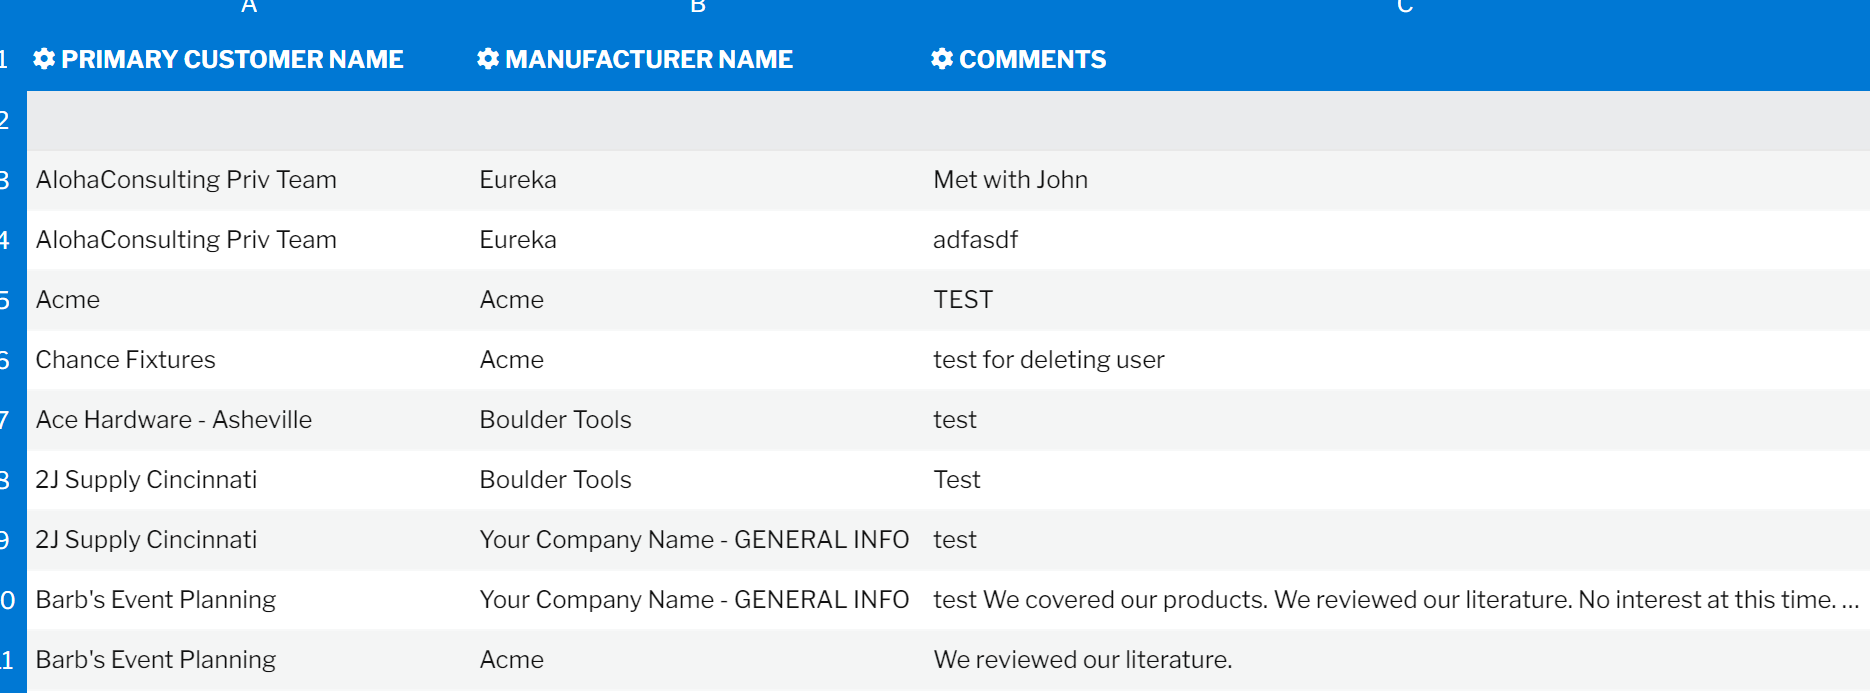
New Detail Flat Reports
In the previous release of Analytics, you needed at least one field to summarize and create a Report. This meant you could not quickly get a flat listing of all Opportunities or AJs to send to your principals/manufacturers.
We have introduced a new set of Reports, denoted as Detail Flat Reports. We have created new Reports for AJs, Opportunities, Quotes, Orders, Sales, and Commissions.
You use them like other reports; just don’t drag a field into the Values section of the Report builder grid. You get a Flat Report listing all rows that match your criteria. You can sort and select records to fit your criteria. The Report can still be customized to the period you need.
When creating a new Report, you have additional choices:
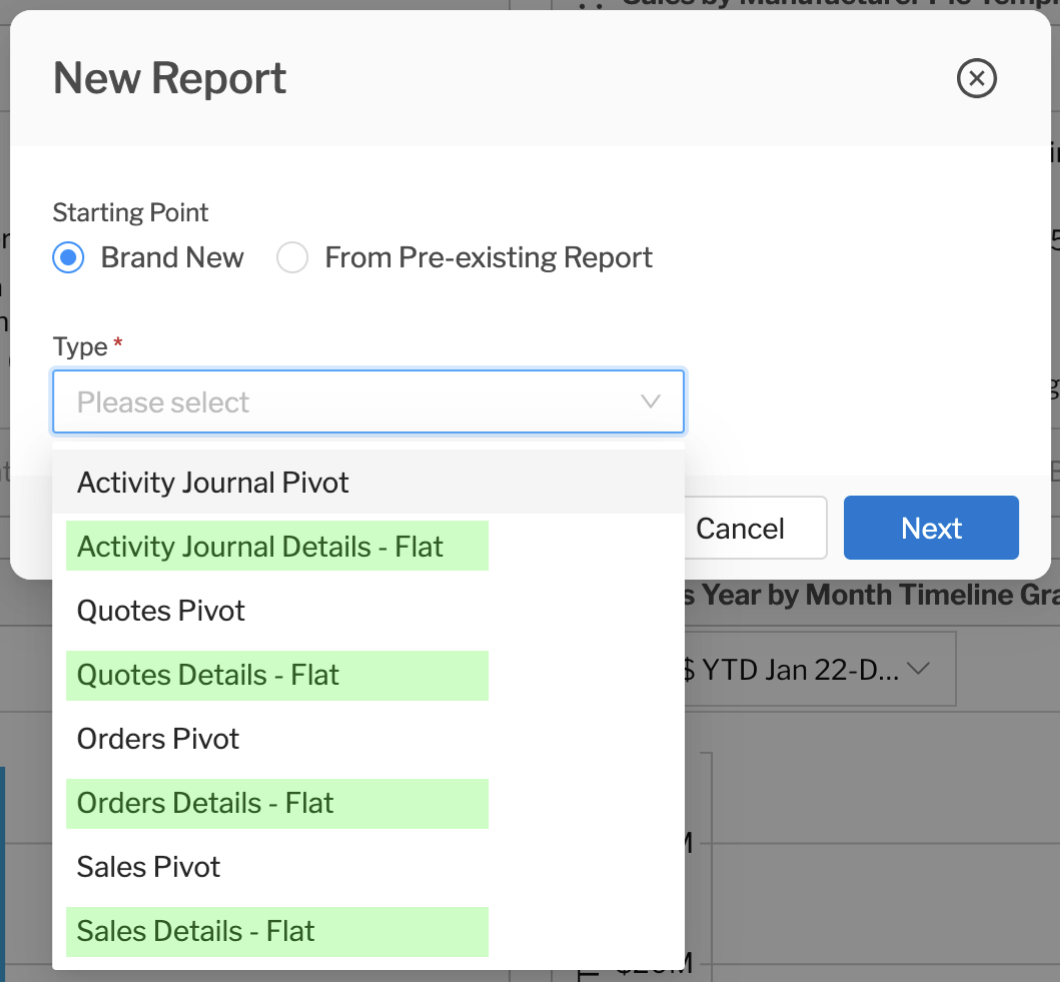
The Report will look like this – no numeric summaries.